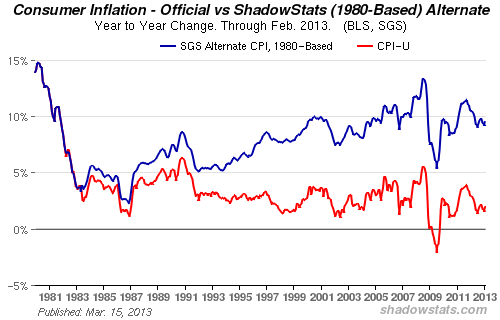
The chart above figures inflation the same way it was figured in 1980, before Reagan, Clinton, Bush reconfigured inflation numbers to mask an obvious effect of the explosion of credit/debt creation which has become the foundation of GDP for the last 30 years.
It is also still excludes EDUCATION and HEALTH CARE which would bring real inflation upwards of 15 % by most estimates.
With this type of real inflation rate and the Fed Funds rate at 0 - real rates are negative by about 15%
With the US total current debt market levels at 350 % of GDP - not including unfunded pensions, transfer programs which brings the number into the 100 trillions - ask yourself this:
How can the Fed (and the ECB and the BOJ and CBC) ever normalize rates?
How can they ever allow rates to rise at all?
That means QE INFINITY until the markets collapse. (QE means printing money which means creating ever more debt)
and/or until the vast middle class goes completely bankrupt.
And then the markets collapse.
What's the end game? How do you protect yourself?
How long can gold consolidate under these conditions?
No comments:
Post a Comment